Calculating the 5-tier Assessments
A Guide for Pre- and Posttransplant Metrics
Background
This website shows 5-tier outcome assessments for three metrics: survival on the waiting list (pre-transplant mortality rate), getting a transplant faster (transplant rate), and 1-year organ survival (first-year graft survival). This guide will detail how these 5-tier assessments are calculated. Or, you can watch this video, "Calculating the 5-Tier Assessments".
While considering guidance from the Agency for Healthcare Research and Quality, SRTR developed the 5-tiered outcome assessment system to make it easier for the public to understand and compare the outcomes of different transplant programs. This is in alignment with the reporting requirements of the Organ Procurement and Transplantation Network (OPTN) Final Rule, which states that OPTN and SRTR, as appropriate, shall "Make available to the public timely and accurate program-specific information on the performance of transplant programs. This shall include free dissemination over the Internet, and shall be presented, explained, and organized as necessary to understand, interpret, and use the information accurately and efficiently" (OPTN Final Rule 121.11(b)(iv)). Further in fulfillment of the Final Rule, the SRTR contractor must identify transplant programs and organ procurement organizations with better or worse outcomes (SRTR Task 3.9.1).
Below we describe how the tiers are assigned for each of the three outcomes presented in the initial search results section of the SRTR website. We first describe how this is accomplished for the 1-year organ survival outcome. A similar methodology is applied to the pretransplant metrics, with a few differences as described subsequently.
1-Year Organ Survival
Step 1. Estimate the Program's Hazard Ratio for First-Year Graft Failure
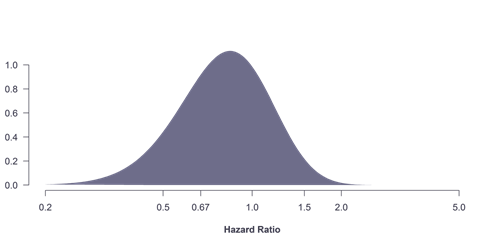
Figure 1. Estimate the program's hazard ratio for first-year graft failure.
The 5-tier assessment for 1-year organ survival is derived from the estimated hazard ratio for first-year graft survival as reported in Table C6 of the program-specific reports (PSRs). The hazard ratio is a measure of how many patients did not survive the first posttransplant year with a functioning graft relative to how many were expected not to survive it. A hazard ratio of 1.0 means that we observed exactly the number of graft failures as expected at the program (after taking into account the types of patients and donors at the program). A hazard ratio of 0.5 means that the program experienced half the failures expected, and a hazard ratio of 2.0 means that the program experienced double the number of failures expected. Estimating outcomes always involves some degree of uncertainty. Therefore, we calculate a bell-shaped curve like the one shown in Figure 1 that describes the likely location of the program's hazard ratio. A narrower bell curve indicates more certainty about the estimate, and a wider bell curve indicates less certainty. Technical information on the estimation of a program's hazard ratio was published in the American Journal of Transplantation.
Step 2. Assign a Score to Each Hazard Ratio Value
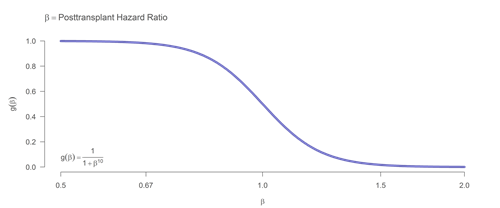
Figure 2. The score function applied to the program’s hazard ratio for first-year graft failure.
Once we have an estimate of the program's hazard ratio (as shown in Figure 1), we assign a score based on the location and spread of the bell-shaped curve. The location of the curve, ie, how far to the left or right it is, tells us whether or not the program’s failure rates are likely better than expected (curve shifts to the left of 1.0) or worse than expected (curve shifts to the right of 1.0). The spread of the bell-shaped curve, ie, how wide or narrow it is, tells us how certain we are of the estimate. To assign a score to the program, we apply a score function (Figure 2). This function assigns more value to hazard ratio estimates that are less than 1.0 (indicating better than expected performance) and less value to estimates that are higher than 1.0. This is shown visually in Figure 2 as the score curve gradually declines moving from left to right.
Step 3. Applying the Score Function
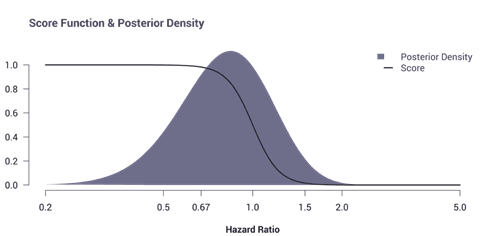
Figure 3. Applying the score function.
Using the score function described in step 2, we arrive at a new bell-shaped curve by applying the score function across the range of the original bell-shaped curve for the program's hazard ratio. This is done by multiplying the value of the score function by the value of the bell-shaped curve along the full range of the curve (Figure 3).
Step 4. Arrive at a Program Score
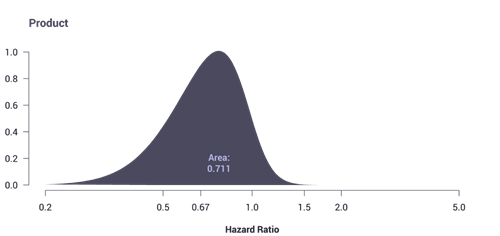
Figure 4. Arriving at a final program score.
After applying the score function to our estimate of the program's hazard ratio as described by the bell-shaped curve, we arrive at a new bell-shaped curve that is a result of multiplying the score function and the bell-shaped curve together. The area under this new bell-shaped curve is the program's score (Figure 4).
Step 5. Assign the Program's Score to an Assessment Tier (1-5)
The final step in the process is to assign the score to tiers. Each program's score will be between 0 and 1, with higher scores indicating likely better performance. Final tiers for the outcome assessment are assigned as shown Table 1.
Table 1. Converting the score into a tier assignment.
|
Score |
Tier Assignment |
|
0 - <0.125 |
1 |
|
0.125 - <0.375 |
2 |
|
0.375 - <0.625 |
3 |
|
0.625 - <0.875 |
4 |
|
0.875 - 1.0 |
5 |
Survival on the Waiting List
The 5-tier assessment for survival on the waiting list is derived from the estimated mortality rate ratio for waiting list mortality as reported in Figure B5 of the PSRs. The mortality rate ratio is a measure of how many patients died before undergoing transplant during the 2-year period evaluated relative to how many were expected to die. The tier for survival on the waiting list is calculated following exactly the same process as described above for the 1-year organ survival outcome, simply replacing the hazard ratio with the mortality rate ratio.
Getting a Transplant Faster
The 5-tier assessment for getting a transplant faster is derived from the estimated transplant rate ratio as reported in Figure B2D of the program’s PSR. For kidney and liver programs, the transplant rate ratio is based on deceased-donor-only transplants as described in the analytic methods. Therefore, this metric provides a measure of the rate at which the program finds deceased donor organs for its candidates. Candidates who undergo living donor transplant are censored from the analysis at the time of the living donor transplant. The process for assigning a tier to the transplant rate ratio is the same as described above, with a few minor differences. Unlike the hazard ratio for first-year organ failure and the pre-transplant mortality rate ratio, where lower ratios are good, higher transplant rate ratios are good. Therefore, the function used to assign a score to the estimated transplant rate ratio is reversed, such that higher transplant rate ratios yield higher scores. The score function applied to the transplant rate ratio is shown in Figure 5. Once the score is calculated, the same tier assignment is applied as shown in Table 1.
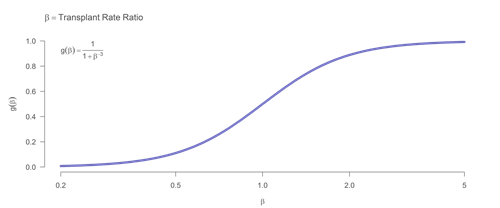
Figure 5. Score function applied to the standardized transplant rate ratio.
