Searches for Transplant Programs
Information, Filters, and Search Results
Background
The SRTR website allows users to search for transplant programs through the search functionality found at the top of all website pages. This guide provides a brief explanation of the information presented in searches for transplant programs. Watch this video about "How to Compare Transplant Programs".
Beginning Your Search for a Transplant Program

Figure 1. Initiating a search for a transplant program.
To find information about a transplant program, users start a search through the search box found at the top of any page on the SRTR website (Figure 1). Users first choose the type of organ transplant program from the drop-down box, and may (optionally) enter a ZIP code, program name (partial names will work), or the program’s 4-character center code (if known). Leaving the search box blank and clicking the Search button brings up national results for the organ chosen. Entering a full or partial program name brings up only names matching the search term. Entering a ZIP code brings up only programs within 50 miles of that ZIP code (users can widen the ZIP code search later).
Additional Search Result Filters
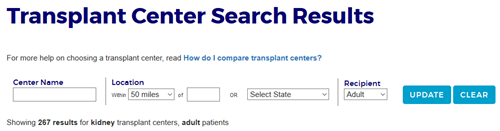
Figure 2. Additional search result filters.
After a search is initiated, a table of results is displayed with additional filters available above the table (Figure 2). Here users can again enter a center name (full or partial), search within a certain distance of a ZIP code, choose a state to narrow the search results by, or switch the results between adult or pediatric data. Search results default to displaying adult data. Switching to pediatric data will display information for pediatric transplants performed at any program, not necessarily only programs at children’s hospitals.
Search Results
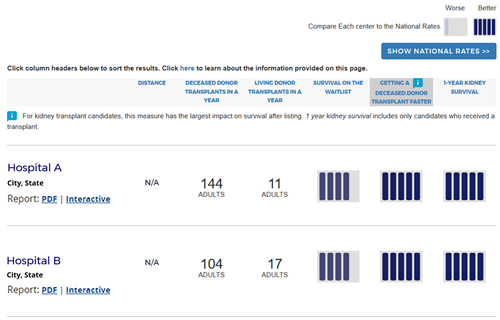
Figure 3. Search results table.
The search results table will return up to 10 programs at a time. If more than 10 programs fit the search criteria, users can page to the next set of results at the bottom of the search results table. The results contain the following columns:
- Program name, location, and links to more summary data about the program or the full SRTR program-specific report (PSR) in PDF format.
- Distance: If a ZIP code is entered as part of the initial search or the additional filters are used after the initial search, the distance from the centroid of that ZIP code to the centroid of the ZIP code of the hospital is displayed. The distance is expressed in miles “as the crow flies.” If no ZIP code was entered, N/A (not applicable) is displayed.
- Deceased Donor Transplants in a Year: This column displays the number of deceased donor transplants the program performed during a recent 1-year period, currently 1/1/2023 – 12/31/2023. This number is shown in the full PSR, Figure A1.
- Living Donor Transplants in a Year (shown for kidney and liver searches only): This column displays the number of living donor transplants the program performed during a recent 1-year period, currently 1/1/2023 – 12/31/2023. This number is shown in the full PSR, Figure A1.
- Survival on the Waiting list [not shown for Kidney search results]: This column displays a 5-tier assessment of the program’s standardized waitlist mortality rate ratio, which can be found in the full PSR, Figure B5. This is a measure of how often patients survive after being registered on a program’s waiting list before undergoing transplant. A full explanation of how this tier is calculated can be found here. In short, programs are grouped by rate of waitlist survival before transplant, from lowest (tier 1) to highest (tier 5). This is evaluated over a 2-year period, for all organs but kidney and lung, currently from 1/1/2022 – 12/31/2023. Note that this column is not displayed when searching for kidney transplant programs. This was piloted in 2016-2018 and feedback was to not display waitlist mortality tiers on the search results for kidney programs given that many kidney transplant candidates are not directly cared for by the program at which they are listed. This waitlist mortality rate ratio for kidney programs can be found within the full PSR, Figure B5.
- Getting a Deceased Donor Transplant Faster: This column displays a 5-tier assessment of the program’s standardized deceased-donor transplant rate ratio, which can be found in the full PSR, Figure B2D. This is a measure of how quickly candidates at the program can undergo transplant with an organ from a deceased donor. A full explanation of how this tier is calculated can be found here. In short, programs are grouped into 1 of 5 tiers. Programs in tier 1 have relatively low transplant rates, and programs in tier 5 have relatively high transplant rates, meaning that their candidates tend to undergo transplant faster than candidates at other programs. Living donor transplants are not included in this metric; therefore, candidates who expect to undergo living donor transplant may choose to pay less attention to it. This is evaluated over a 2-year period, currently from 1/1/2022 – 12/31/2023.
- 1-Year [Organ] Survival: This column displays a 5-tier assessment of the program’s success rate through the first year after transplant, which can be found in the full PSR, Table C6. Success is defined as being alive with a functioning transplanted organ 1 year after the transplant. A full explanation of how this tier is calculated can be found here. In short, programs are grouped into 1 of 5 tiers based on their 1-year success rates. Programs in tier 5 have the highest rates of success. This is evaluated in transplants performed over a 2.5-year period, currently from 1/1/2021 – 6/30/2023.
Additional Information in the Search Results Table
Some additional information is provided to aid users:
- At the top of the search results is a button labeled “Show National Rates.” Clicking this button opens a table that provides context for each of the 5-tier assessments, allowing users to better interpret what to expect at a tier 1 program vs. a tier 5 program.
- A blue icon (
 ) appears above one of the search results columns, indicating which of the three assessments has the most overall impact on a patient’s chance of survival after registration on the waiting list. For kidney, liver, and heart programs, the icon appears above the “Getting a Transplant Faster” column. For lung programs, the icon appears above the “1-Year Lung Survival” column. Click here for more information about how SRTR determines which column is most important to overall patient survival.
 - The columns are sorted by default by the column with the icon. Clicking on the header of any column will re-sort by that column. For a full description of the sort order, click here.